METHODS AND STUDY AREA
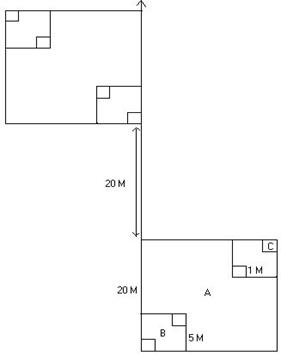
The forest vegetation was sampled using transect-based quadrats, amethod found useful especially in surveying forested landscaped of central Western Ghats (Chandran and Mesta 2001; Ramachandra et al. 2006; Ali et al. 2007). Remote sensing imageries were used and ground surveys made to select sample plots (Figure 2 for locations). Along a transect of 180 m, 5 quadrats each of 20x20 m were laid alternatively on the right and left, for tree study (minimum girth of 30 cm at GBH or 130 cm height from the ground), keeping intervals of 20 m length between successive quadrats. Within each tree quadrat, at two diagonal corners, two sub-quadrats of 5 m × 5 m were laid for shrubs and tree saplings (< 30 cm girth). Within each of these 2 herb layer quadrats, 1 sq.m area each, were also laid down for herbs and tree seedlings (Figure 3). Climbers and other associated species were noted. A rapid assessment was made to track vegetational changes from the densely populated coast through the rugged mountainous terrain to the undulating and drier eastern lands using point-centred quarter method along line transects Ankola (coastal) and Yellapur (hilly to undulating) taluks. Sampling efforts were higher in high endemism areas (eg. Kathalekan in Siddapur). Details of formulas used for various calculations are given in the Table 2.
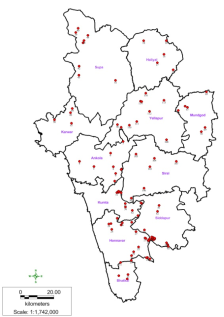
Figure 2: Distribution of sample study sites in Uttara Kannada forests
The data collected was analyzed to calculate the species diversity using Shanon-Weiner’s diversity index, Simpson dominance index, IVI, regeneration status, basal area, biomass and carbon sequestration potential. The Pearson Correlation Matrix with probabilities was calculated by using the ‘R’ software. A Principal Component Analysis (PCA) was carried out using the package PAST version 2.16. This ordination technique was used to analyze the relationship between the samples and to understand the main factors influencing the forest vegetation in Uttara Kannada (Table 2). In addition, the loading score for each variable was calculated; the values were then converted into conservation scoring system and added to the respective variable (next section)
Table 1: The extent of forest areas released for other purposes from 1956
S.No. |
Particulars. |
Area in Ha. |
1 |
The forest area released for cultivation by 3 member committee from 1964 to 1969 |
6042.500 |
2 |
Forest area released as per special G.O.No.AFD.116 of 16/4/69. |
11593.342 |
3 |
Forest area released as per G.O.No.AFD-282-FGL74 of 17/19-12-1974. |
3399.400 |
4 |
Forest area released for long lease. |
162.100 |
5 |
Hangami Lagan in Notified area. |
8034.450 |
6 |
Extension of Gouthana. |
390.400 |
7 |
Forest area released for township. |
1096.900 |
8 |
Mining area leased & area actually in operation. |
1591.250 |
9 |
Released to House sites to Houseless (1972-1979) |
366.000 |
10 |
Rehabilitation of Tibetans displaced Ryots of Sharavathi Ghataprabha & Malaprabha, Gowli families etc. |
4548.170 |
11 |
Area under submersion & other Project.
1. Kali Hydro Project.
2. Bedti Project (for colony)
3. Other irrigation tanks etc. |
14602.000
300.000
303.365 |
12 |
Released to KSFIC for Napier Hybrid grass cultivation (Sirsi Division) |
441.450 |
13 |
Released to KAMCO (Dairy & fruit processing Unit) |
153.993 |
14 |
Released to KSFIC for Pineapple cultivation. |
163.320 |
15 |
Karnataka State Veneers Ltd. |
24.000 |
16 |
Power transmission lines. |
677.979 |
17 |
For establishment of Industries. |
95.000 |
18 |
Area released to Horticulture department (1969-70). |
71.847 |
19 |
Released to Agricultural University, Dharwad. |
214.000 |
20 |
Sharavathi Tail Race. |
700.000 |
21 |
Kaiga Atomic Power Project. |
732.000 |
22 |
Sea Bird Naval Base Project. |
2259.000 |
23 |
Rehabilitation of Sea Bird out seas. |
643.720 |
24 |
Area released for non-agriculture & other purposes. |
394.870 |
25 |
Konkan Railway. |
272.140 |
26 |
Area released for improvement & widening of Ankola-Hubli Road. |
49.431 |
27 |
Area released for rehabilitation of displaced persons of KHEP & Kaiga Project. |
316.410 |
28 |
Area released to regularise the encroachments, which have taken place before 27-04-1978. |
2845.446 |
29 |
Area released to construction of 400 KVDC alternate transmission line between Kaiga NPP and 200 KV sub-station at Narendra in favour of M/s. P.G.C.I.L, Karnataka. |
330.00 |
|
TOTAL |
62814.483 |
*Source: Forest working plan of Kanara circle (year 2009-10)
Figure 3: Design of transect cum quadrats (2 of 5 quadrats of 20x20 m only shown)
The above ground standing biomass of trees is referred to the weight of the trees above ground, in a given area, if harvested at a given time. The change in standing biomass over a period of time is called productivity. The standing biomass helps to estimate the productivity of an area and also gives information on the carrying capacity of land (Ramachandra and Kamakshi, 2005). It also helps in estimating the biomass that can be continuously extracted. Carbon storage in forests is estimated by taking 50% of the biomass as carbon. The mathematical equations for biomass estimations of trees have been developed and used by many researchers for different biogeography regions. For the current study, the standing above-ground biomass was calculated using the basal area equation and indirect estimation was done for calculating below ground biomass (Brown, 1997; Ravindranath et al. 1997; Murali et al. 2005; Ravindranath and Ostwald, 2008). The resultant total biomass was multiplied by 0.5 for estimating the carbon storage.
Table 2: Details of indices and calculations and softwares used |
Index |
Equation |
Notes |
% Evergreenness (trees) |
No. of evergreen trees X 100
Total no. of trees |
To estimate how evergreen a forest is. |
% Endemism (trees) |
No. of endemic trees X 100
Total no. of trees |
Percentage endemism of a forest patch |
Basal area (m²) |
(GBH)²/4π |
|
Important Value Index |
R. density + R. frequency + R. basal area |
To know dominant and co-dominant species |
Density |
No. Species A
Total no. of trees |
Provides information on the compactness with which a species exists in an area. |
Relative Density |
Density of Species A x 100
Total density of all species |
|
Frequency |
No. points with Species A
Total No. points Sampled |
Provides information on the repeated occurrence of a species |
Relative Frequency |
Frequency of Species A x 100
Total Frequency of all Species |
|
Relative basal area |
Basal area (m²) of Species A X 100
Total basal area of all species |
|
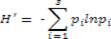
Shannon Weiner’s diversity index |
|
The value of Shannon’s diversity index is usually found to fall between 1.5 and 3.5 and only rarely surpasses 4.5. |
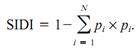
Simpson’s dominance index |
|
|
Above Ground Biomass (AGB) (t/ha) |
-2.81 + 6.78 (BA) |
|
Below Ground Biomass (BGB) (t/ha) |
0.26 * AGB |
|
Carbon storage |
(AGB + BGB) * 0.5 |
|
Pearson correlation matrix |
R software |
To estimate correlations between the parameters under consideration |
Principal component analysis |
Package PAST version 216 |
to analyze the relationship between the samples; to understand the main factors influencing the forest vegetation |
Composite conservation index |
Ranking of sites based on values assigned to key parameters of trees. Valuation system adopted for based on principal component analysis with loading score |
PCA was used to analyze relationship between samples and to understand main factors influencing forest vegetation. Loading score obtained was added to a relative valuation score of key parameters decisive for conservation. Degree of correlation between key parametes was arrived at through Pearson correlation matrix. As evergreenness and endemism are strongly correlated, only one parameter (%endemism) was assigned a conservation value. The rest- height, basal area and diversity index having relatively lesser importance in endemism were given lesser values. Presence in a site of IUCN Red Listed tree species given higher valuation related to degree of threat. |
Citation : Ramachandra T.V., Subash Chandran M.D., Rao G R, Vishnu D. Mukri and Joshi N.V., 2015. Floristic diversity in Uttara Kannada district, Karnataka, Chapter 1, In Biodiversity in India-Vol. 8, Pullaiah and Sandhya Rani (Eds), Regency publications, New Delhi, Pp 1-87
Corresponding author:
|
| |
Dr. T.V. Ramachandra
Energy & Wetlands Research Group, CES TE 15
Centre for Ecological Sciences
New Bioscience Building, Third Floor, E –Wing
[Near D-Gate], Indian Institute of Science,
Bangalore – 560 012, INDIA.
Tel : +91-80-2293 3099/2293 3503 - extn 107
Fax : 91-80-23601428 / 23600085 / 23600683 [CES-TVR]
E-mail : cestvr@ces.iisc.ac.in, energy@ces.iisc.ac.in,
Web : http://wgbis.ces.iisc.ac.in/energy |
|